California Actual Evapotranspiration (CalETa) Mapping Program
A comprehensive tool for water resources management
Effectively managing California's water resources starts with access to comprehensive and accurate information.
California's demand for water greatly exceeds the available resources.
Understanding, managing and improving water resources requires information that is accessible, consistent, validated, transparent, and cost-effective.
In response to this need, Formation Environmental, LLC (Formation) developed the California Actual Evapotranspiration (CalETa) Mapping Program, a comprehensive framework for spatially mapping daily Actual Evapotranspiration (ETa) using satellite earth observation data and algorithms.
CalETa is an unprecedented, daily, 30-meter spatial resolution, statewide ETa dataset.
Framework
The CalETa framework is based on publicly available satellite imagery (Landsat 5, 7, and 8 sensors), meteorological data from the California Irrigation Management System (CIMIS), and the open source Surface Energy Balance System (SEBS) algorithm.
SEBS is a peer-reviewed, robust, economical, and efficient tool to quantify ETa. Validation studies conducted on SEBS in various environments worldwide show a consistent performance.
SEBS was calibrated for California's environment, and various components were added including an atmospheric correction algorithm, a daily-reference ET-based extrapolation algorithm, and a cloud-screening sub-model.
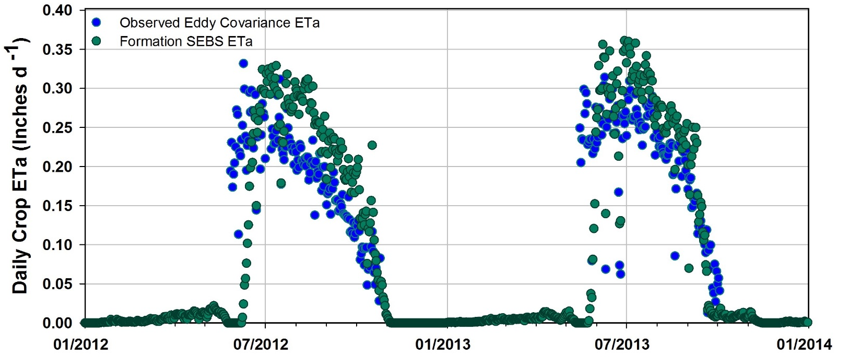
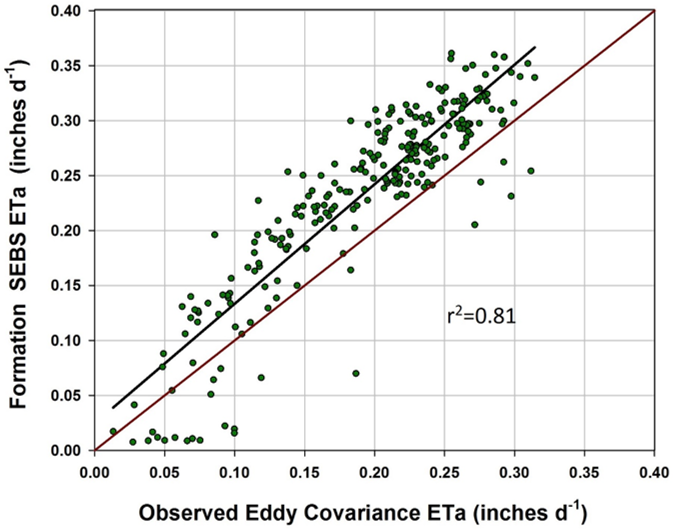
The following figures show a comparison of CalETa and two years of Eddy Covariance data on a rice field in Butte County, California. An r-squared value of 0.81 indicates good performance of the framework.
Stakeholders
CalETa is designed to be more than a data source; it is a platform for visualizing and understanding California's water resources.
CalETa can be viewed through an online, dynamic map application. This access provides all stakeholders an opportunity to develop solutions based upon proven methodology.
This visual presentation can ensure transparency and access to all stakeholders and constituents.
CalETa's methodology and input data sources are documented, validated, and available for review, providing shared knowledge on the input information used to make decisions.
Decision-makers and stakeholders can reduced conflict over monitoring, reporting, and decisions made through the shared use of CalETa.
Examples of Use
Pricing
Pricing varies based upon project needs. Variables for pricing include:
- Area of Interest (Statewide, County, water agency, river corridor, etc.)
- Resolution
- Spatial (highest resolution: 30 meters, field boundary scale, AOI)
- Temporal (daily, monthly irrigation season, annual)
- Timeframe (2010-2016 currently processed with 2017 in progress. Earlier data, starting from early 1990’s can be processed.)
- Delivery Format
- Online access to dynamic map services
- Hard-copy maps and figures
- Data download
- Additional services (data analysis, modeling, modeling support, additional mapping)
- Additional products (mapping, quantification and health of native and managed vegetation)
Contact
Contact a CalETa representative: